Home Quantitative Research
Quantitative Research
There are some instances where quantitative methods (e.g., surveys, scales, etc.) are the right tool to collect user experience research, and my background in survey methodology comes in handy at those times in order to collect the most accurate objective data possible. I am proficient in several survey design tools including Qualtrics, Confirmit, Wufoo, and Survey Monkey.
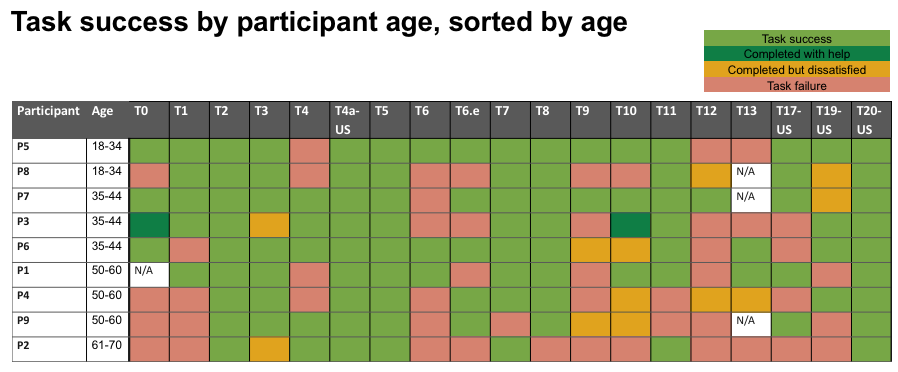
Task Success Rates
Challenge — Determine whether the following claim had merit: Only older participants have trouble with tasks; younger participants succeed at these tasks without any issues. Since this is a product geared toward younger users, the results of this testing should not be be taken into account in product design.
Research approach and results — By listing the participants by age, it was easy to see that this claim had no merit — Tasks that were difficult, were difficult across the board, and younger participants also failed to complete them nearly as much as older ones.
Research impact on design and business — Task difficulty for participants of all ages showed product designers that the UI must be redesigned.
Treejack (information architecture) Testing
Challenge — Determine whether user would have trouble completing critical tasks using the TV menu structure as it stood currently, and find out which menu items needed restructuring or multiple placements within the menu, and which items needed relabeling.
Research approach and results — By conducting this quantitative Treejack test we were able to quickly assess which TV menu items were not placed optimally, and get ideas as to where participants expected to find them. In terms of results, once participants arrived at the correct response, they rarely returned to another place in the menu. This demonstrates an issue in information architecture more than an issue of labeling correct responses. However, labeling of categories along the path to the correct response is an issue.
Research impact on design and business — Product managers took this information into account when thinking about TV menu structure and restructure.

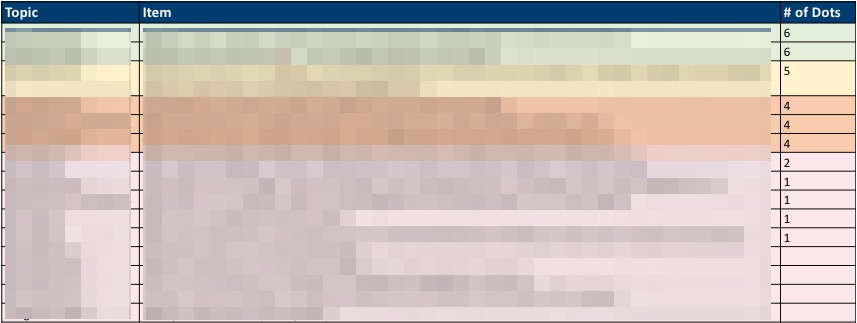
Focus Group Dot Voting
Challenge — In the context of a focus group, determine which features of a UI were determined to be most valuable by group members.
Research approach and results — Posters of each feature were hung around the room, and each participant was given 5 sticks dots and instructed to affix 1 dot to the features that they considered to be the top 5 most valuable to them personally. By adding up the dots next to each feature, it became quickly apparent which were the ones that should be focused on during the discussion.
Research impact on design and business — Being able to focus on the most valuable features allowed the business to understand why these features were important to participants, and therefore help them understand where they should spend their time and energy from a user perspective.